Data-driven decisions for scaling your application
Your app is running mostly fine, only occasionally you see a burst in CPU or RAM usage. It handles requests well, only sometimes it feels sluggish for a few seconds, then it works well again. You’re quite confident the app handles current users fine but you rather buy some more computing power just to be extra safe if there’s a sudden spike in demand. You’re not sure if moving to virtualized hardware won’t hurt your users.
Sounds familiar? What if we stopped guessing and tested our application? The following image is from load testing of a bridge in Prague in 1973 before being fully finished. Let’s adopt the practice common in more rigorous fields of engineering.

This post will guide you through the steps that make you know your producet better.
- Know what your traffic looks like.
- Automate your load tests.
- Be able to automatically deploy the production version of your application.
Start with the logs
You most likely have a good understanding what your app can do, what are its features. However, that’s not enough for effective load testing. Checking your endpoints one by one gets you quite far with functional tests but your features can interact in unexpected ways. A slow enpoint may be completeley innocuous for the rest of the application or it can make your users enjoy a slow-motion movie.
Your logs record time of the request processing, don’t they? It will help you establish a baseline to compare with the environment under test and find the requests that take a lot of time and therefore definitely should be part of the test suite. In Nginx, for example, you need to add $request_time to your log_format setting.
Now, it’s time to get logs from your server for a period of time that’s long enough that you capture the seasonal patterns. Most of the apps experience spikes in traffic that repeat daily, weekly or even yearly (think Christmas shopping season).
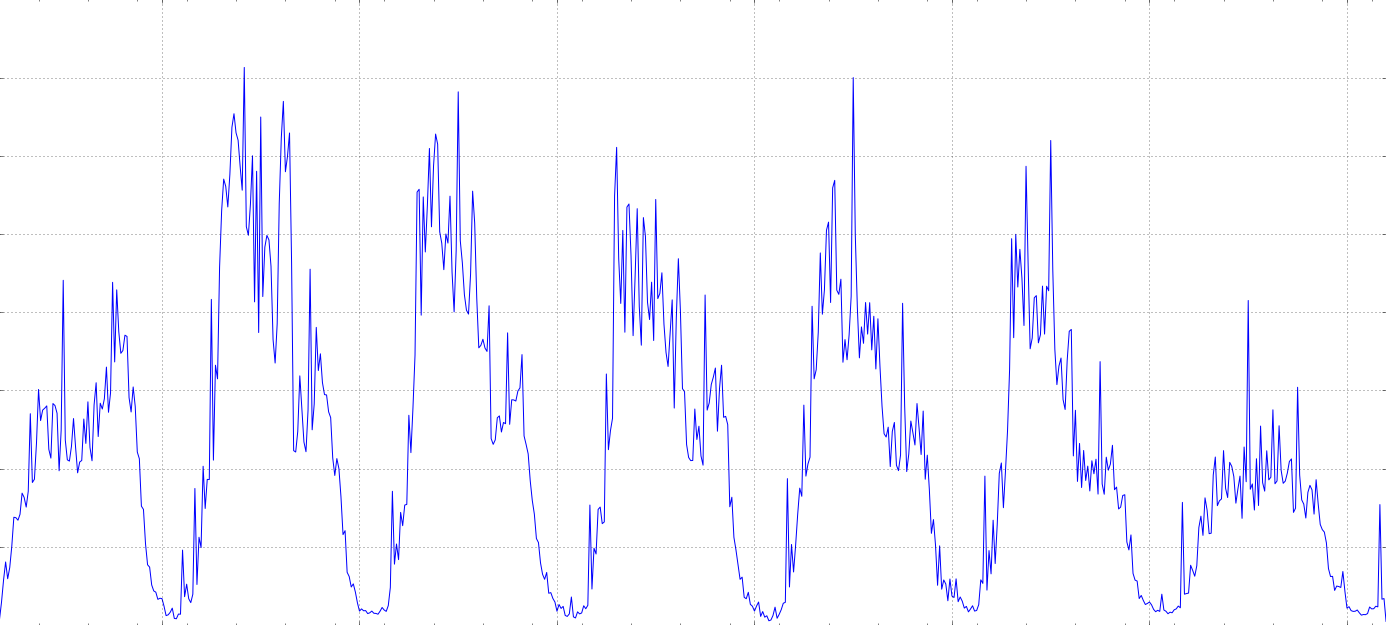
The goal is to find the most common requests (plus those that take the most time in total) and their relative frequencies. When computing the statistics, take into account only your peaks. After all, you want to simulate the load, don’t you?
Useful tools for this task are either Jupyter notebook + Pandas or Excel. I chose doing it in Jupyter, because I wanted to join together the URLs that differ only in view parameters and I did it by parsing the URLs from logs with django.urls.resolve.
In the end, you should have a list of requests and the percentage they make in the total traffic. You’ll need to implement the load tests only for the endpoints that take a lot of time or those that are hit often. The rest will most probably be fine.
| Endpoint | Requests % | Time % |
|---|---|---|
| homepage | 20.1 | 2.1 |
| search | 2.0 | 8.7 |
| product_details | 57.3 | 40.0 |
Automating the tests
Choose a load testing framework. It will help you with overall logic, computing the statistics and nice reports. Among good choices are Apache JMeter or Locust. Locust is less mature but much simpler. I’ll show examples as done in Locust.
Logging in
Some pages may need authentication to access. Modern apps also have some form of CSRF protection. With Locust, you can implement such login this way:
class LoggedInTasks(locust.TaskSet):

    def on_start(self):
        login_page = self.client.get("/login")
        token_tag = re.search(r'<input [^>]*name=[\'"]?csrfmiddlewaretoken[^>]*>', login_page.text).group(0)
        csrf_token = re.search(r'value=[\'"]?([^>\'" ]+)', token_tag).group(1)
        self.client.post("/login",
                         dict(username="test@example.com",
                              password="YouGuessIt!",
                              csrfmiddlewaretoken=csrf_token))

    @task(10)
    def my_account(self):
        self.client.get("/my-account")
Task frequencies
Did you notice the @task(10)? When Locust chooses next task, this one will get importance of “10”. The number is relative to other tasks so it will execute roughly twice as much as @task(5).
If you wouldn’t test user actions that span multiple requests and you had only one simulated user type, you would put here directly the request percentages.
Multi-step workflows
Sometimes, an action makes sense only if it directly follows another. Resolving customer support ticket can’t happen unless you’ve created it before. Locust has a method schedule_task which lets you say that you want some task to be performed as a later action. Locust will execute the task instead of some task it would choose at random. It respects your settings for delay between requests.
    @task(2)
    def create_ticket(self):
        ticket_created = self.client.post("/new-ticket",
                                          {"title": "Test", "body": "I need help!"})
        ticket_id = re.search(r'Created ticket #(\d+)',
                              ticket_created.text).group(1)

        self.schedule_task(self.resolve_ticket, kwargs={"ticket_id": ticket_id})

    # Will be called some time after create_ticket
    def resolve_ticket(self, ticket_id):
        self.client.post("/ticket/{}/resolve".format(ticket_id),
                         {"status": "complete"})
With multi-step workflows and with different user profiles, you won’t have a number from the log to set as frequency. Instead, you can run the tests quickly a few times and watch if the real request numbers match those you expect.
Preparing the application
Ideally, you can deploy the application automatically. It will help you run the tests on different hardware or with tuned parameters.
The application configuration should be as close to production as possible. Development version might do excessive logging that slows it down or skip some work due to mocks. This means deploying also all the services the application depends on - database with correct performance settings, caching service, etc.
The application data are very important. The database is often the bottleneck and if you test your app with empty database, you’ll get a completely different picture. If your app can send e-mails or SMS messages, be sure to tweak the data. Even an anonymised database (with tool like pgantomizer) may contain random real phone numbers or e-mails. Replacing some.name@gmail.com with some.name_gmail.com@yourdomain.com and all phone numbers with your own cell phone number are quite effective in preventing the damage of a configuration mistake.
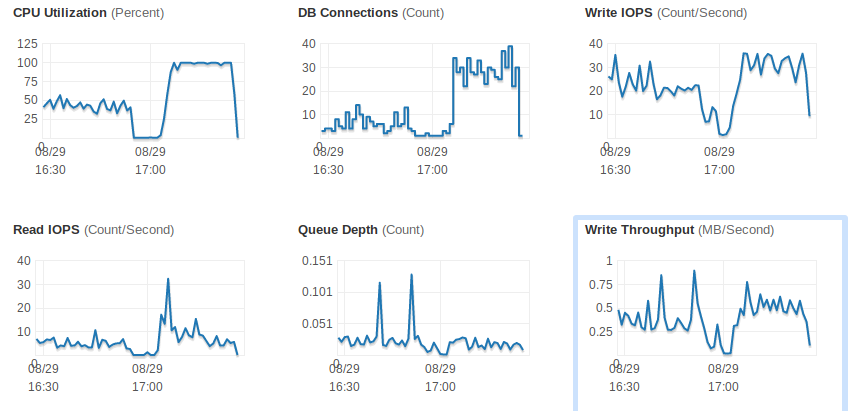
Gather telemetry about the servers under load. It will help you identify the bottlenecks. Below you can see a record showing the chosen database instance size was a bottleneck due to its CPU power.
Interpreting results - what’s the fuss about percentiles?
At this point, you may have noticed your test framework doesn’t give you average response times but percentiles. A 98th percentile of 15 ms means that 98 % of requests were faster than 15 ms (and 2 % were slower).
Looking at the distribution helps you identify problems around shared resource contention. Does this request sometimes take 5x more time than usual? Maybe it competes with a slow request for a database row lock.
Result of your test
A good result of load testing is when you can report what changes are needed to sustain 10x or 50x more users. Usually the change means better hardware but it may also consist in fixing a performance bottleneck in software.
This is an actionable information. You know that for entering a new market X where you expect Y new users, you need to spend $Z more on hardware.

filip at sedlakovi.org - @koraalkrabba
Filip helps companies with a lean infrastructure to test their prototypes but also with scaling issues like high availability, cost optimization and performance tuning. He co-founded NeuronSW, an AI startup.
If you agree with the post, disagree, or just want to say hi, drop me a line: filip at sedlakovi.org